
Using the Compliance Dashboard
Introduction
As with all Dashboards, there is a default version with various useful, built-in widgets as well as the option to build Custom Dashboards with custom and built-in widgets.
Step-by-Step Guide
Navigate to the “Dashboard” page in the Compliance Module
The default dashboard contains a trend graph, a recent activity log, a Compliance Action Item grid, and two grids with Expiring and Pending Evidence Items.
By using the dropdown menu at the top right, custom dashboards can be accessed, or new dashboards can be created.
Default Dashboard Features
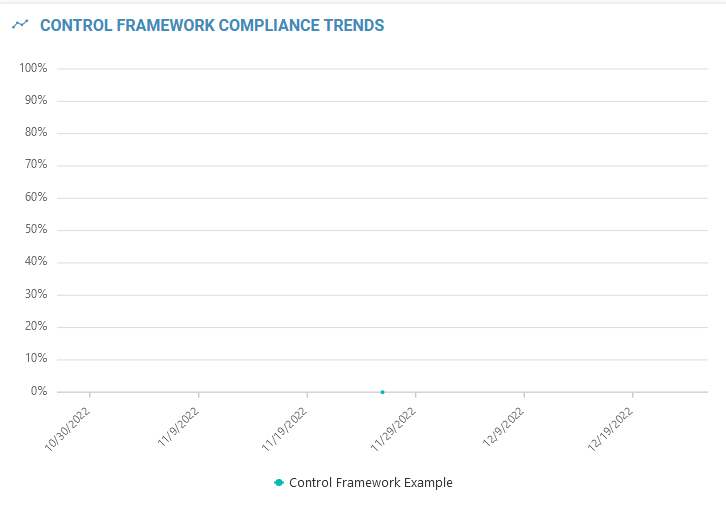
Trend Graph
There is a graph that tracks the overall compliance percentage of each Control Framework in the Organization over time. The lines for each Framework can be toggled on or off.
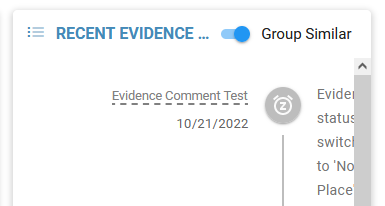
Evidence Activity
Along the right, there is a feed of recent Evidence activity that covers Evidence across all Frameworks.
Action Items
Below the trend graph is a Compliance Action Item Data Grid.
Expiring/Pending Evidence Grids
The final two features are unique tables that contain all Evidence with their statuses either set to expiring or pending validation.