
Using the Testing Dashboard
Introduction
As with all dashboards throughout the Platform, the Testing Dashboard has both a default version with built-in features and custom dashboards that can be created by each Organization.
Step-by-Step Guide
Navigate to the “Dashboard” page in the Testing Module
The default dashboard contains two graphs that track all Assessments and Vulnerabilities and a table of all Vulnerabilities with a High priority.
By using the dropdown menu at the top right, custom dashboards can be accessed, or new dashboards can be created
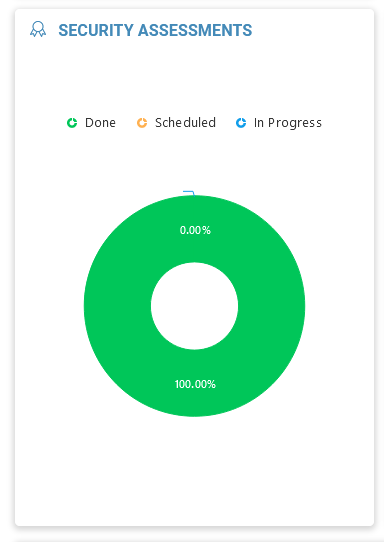
Assessments
The Security Assessment widget displays the status of all Assessments within an Organization in a pie chart.
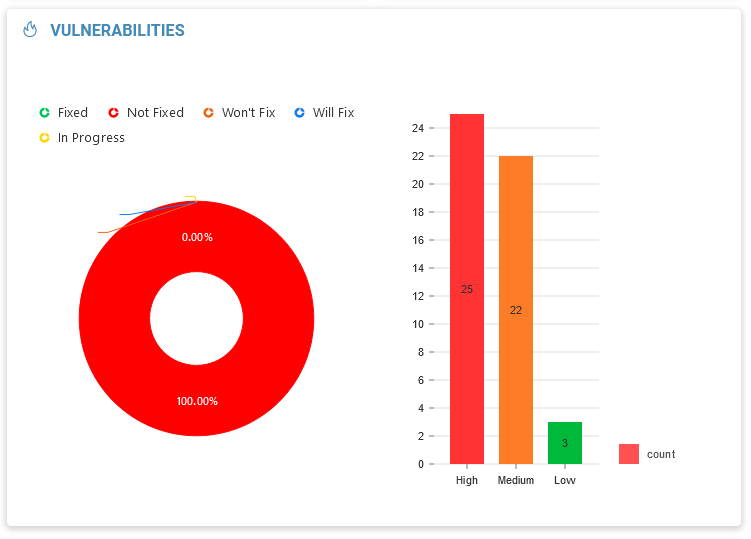
Vulnerabilities
The Vulnerabilities graph widget displays two info graphs. The pie chart displays the status of all Vulnerabilities in an Organization. The bar graph displays the number of each priority level.
Vulnerability Table
The last feature of the pre-made Testing Dashboard is a unique table that displays all Vulnerabilities that have a High priority.